Using the Canvas
In this tutorial you will get to know the HexaPDF::Content::Canvas class which is the low-level class for drawing on a page. You might want to open the resulting PDF to more easily understand the operations.
Basics
The canvas class provides access to all PDF drawing instructions. The available instructions are
quite similar to other canvas implementations, like the HTML <canvas> element. So you can style
and draw graphics as well as text.
The main difference between e.g. the HTML canvas and the PDF canvas is that the PDF canvas methods result in a stream of text instructions that define the content of a PDF page. Whereas the result of HTML canvas methods is an image. This means that one could write the text instructions themselves instead of using the canvas methods. However, since certain rules have to be followed, it is not advised to do so.
With that out of the way, let’s draw some things!
Creating a Canvas
An instance of the canvas class is always tied to one of two PDF objects: a page or a Form XObject. The reason is that the content needs to be associated with such an object to be usable/displayable and that sometimes during drawing operations PDF objects need to be created and correctly assigned.
Therefore the two type classes provide a #canvas method for getting the appropriate canvas
instance:
require 'hexapdf'

doc = HexaPDF::Document.new

page = doc.pages.add
canvas = page.canvas

form = doc.add({ Type: :XObject, Subtype: :Form, BBox: [0, 0, 100, 100]})
form_canvas = form.canvas
Note that we need to define the bounding box for the Form XObject. The bounding box of a page is its crop box which defaults to the page size by default (which is A4 by default). Anything drawn outside the bounding box/crop box will not be visible.
To access the bounding box of the underlying PDF object we can use the
#box method:
page_box = canvas.context.box
Coordinate System
The coordinate system of the canvas follows the mathematical model. This means that the positive x-axis is to the right and the positive y-axis to the top. The origin is at (0, 0) which usually coincides with the lower-left corner of the bounding box (but doesn’t need to). Coordinates are specified in PDF points where 72 PDF points are one inch (= 25.4mm).
It is possible to transform the coordinate system using various methods, like the general
#transform method or the more specific
#translate method.
Let’s move the origin to somewhere else and draw a rectangle inside which we will draw things:
canvas.translate(100, 100)
canvas.rectangle(0, 0, page_box.width - 200, page_box.height - 200, radius: 15).stroke
Since we translated the origin to the point (100, 100), the rectangle’s lower-left corner will actually be at (100, 100) instead of (0, 0).
Graphics State
The canvas (and also later the PDF application rendering the instructions) keeps track of the so called graphics state.
The graphics state contains properties like the fill and stroke colors, the line width, the font, the character spacing and the current transformation matrix. It is accessible via the #graphics_state method of the canvas.
Let’s use the current transformation matrix of the graphics state to find out the real position of the current origin:
# Note that one would normally use canvas.pos(0, 0) for this
p canvas.graphics_state.ctm.evaluate(0, 0)  # prints [100, 100]
Since some changes to the graphics state can’t be undone, like certain coordinate system transformations or clipping operations, it is possible to save and restore the graphics state:
canvas.save_graphics_state do
  canvas.rectangle(-50, -50, 100, 100).clip_path.end_path  # restricts drawing operations
  canvas.fill_color("lightgreen").opacity(fill_alpha: 0.5).
    rectangle(-100, -100, 1000, 1000).fill
end
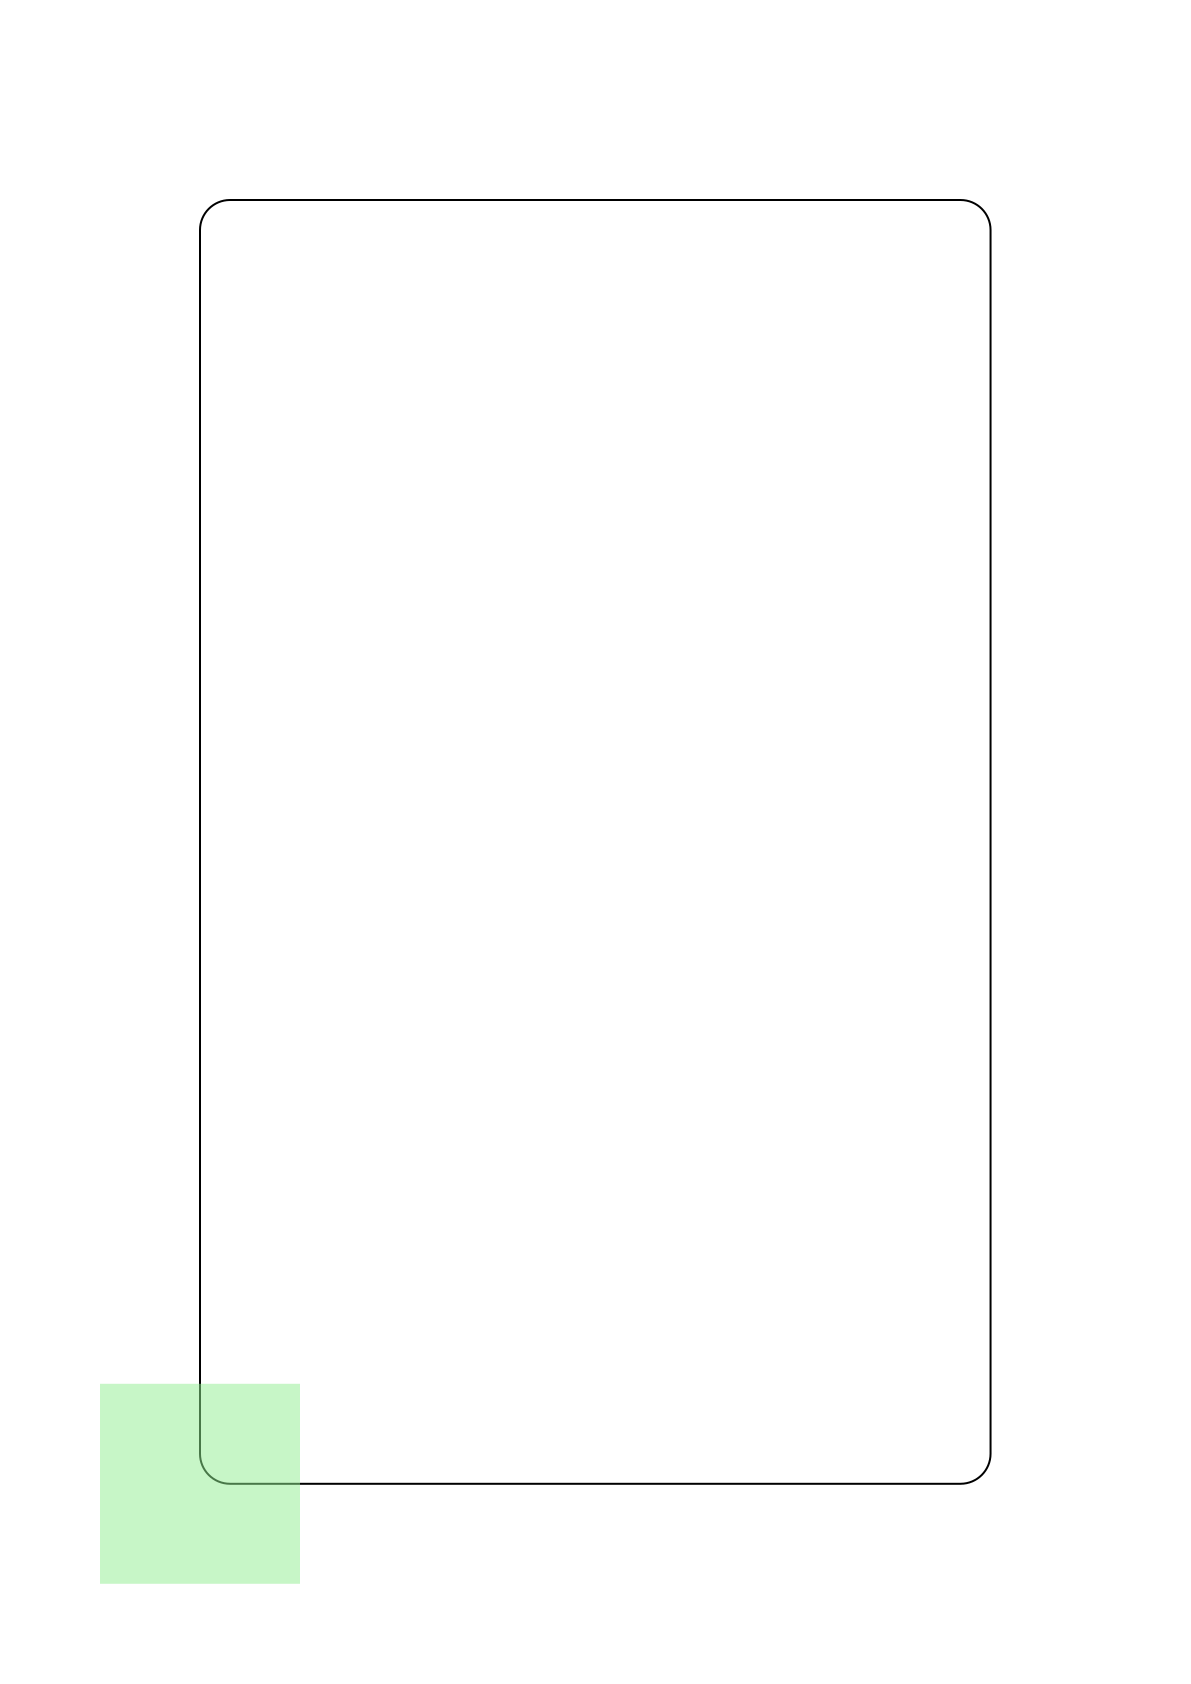
The above instructions fill a rectangle of size 100x100 instead of 1000x1000. If we hadn’t saved the graphics state before and restored it afterwards, we wouldn’t be able to draw anywhere else from this point onwards.
Drawing Graphics
As already said the canvas class provides methods for all PDF drawing instructions. Since those are only low-level constructs there are also some methods that can draw more common graphics like circles.
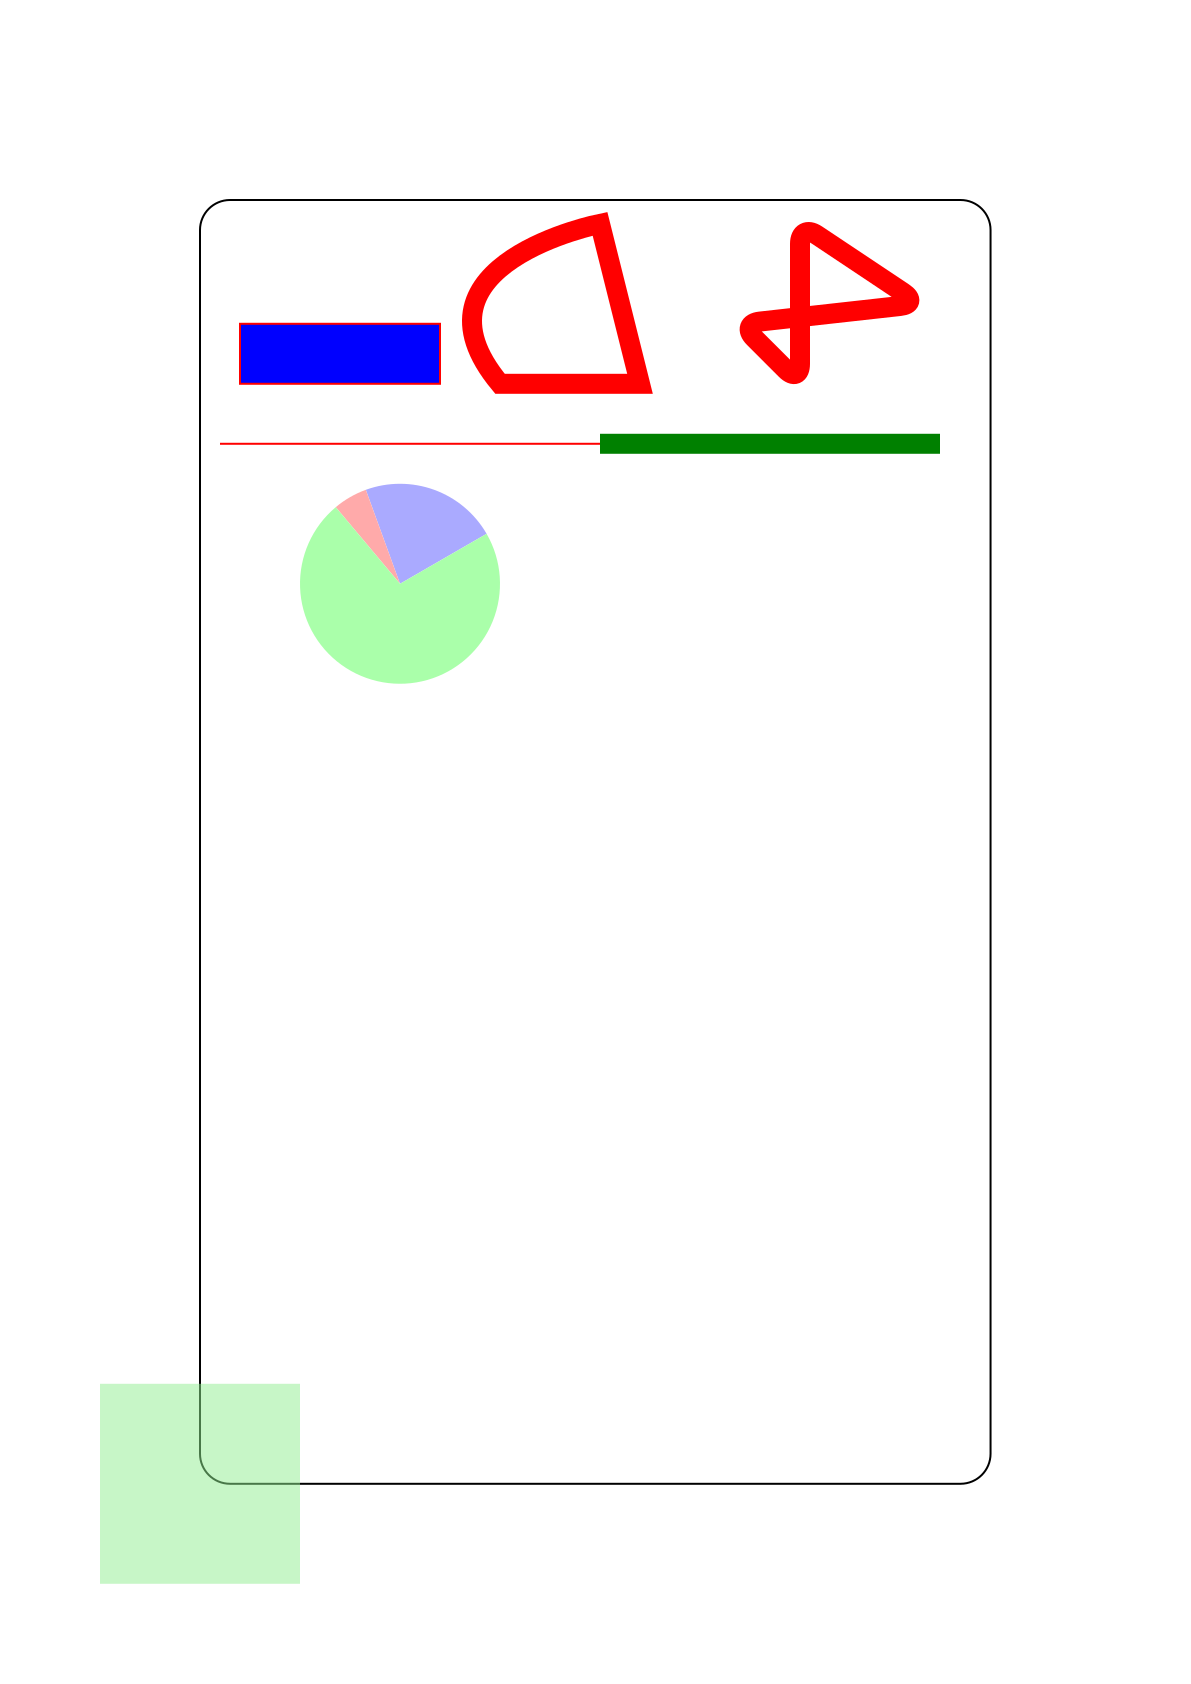
Let’s draw some basic shapes. We start at the top left, so the y-coordinates are initially high and will get lower:
canvas.fill_color("blue").stroke_color("red").
  rectangle(20, 550, 100, 30).fill_stroke
canvas.line_width(10).
  move_to(150, 550).curve_to(200, 630, p1: [100, 610]).
  line_to(220, 550).close_subpath.stroke
canvas.polygon(300, 550, 300, 630, 360, 590, 270, 580, radius: 10).stroke
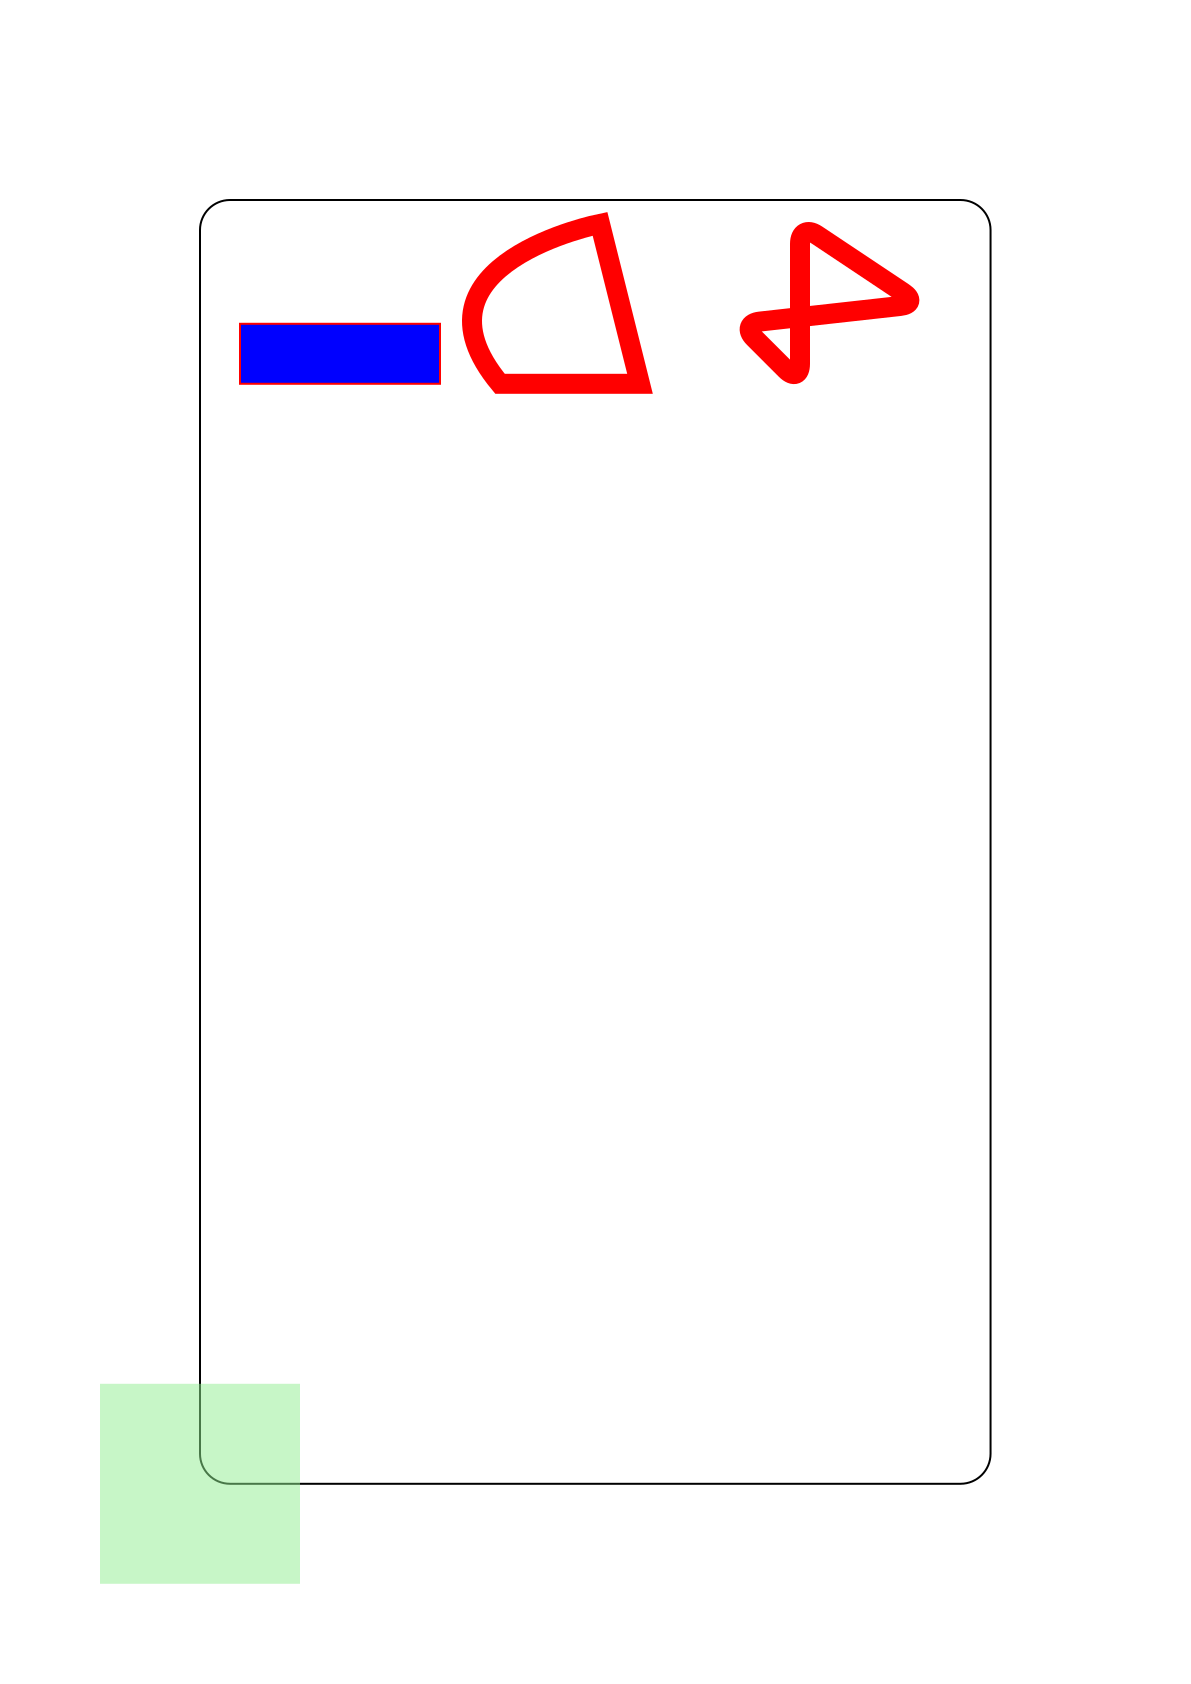
Note that we first change parts of the graphics state, setting the fill color to blue and the stroke color to red. Although it might seem that this change is restricted to the rectangle, it is actually not. The same happens with the line width which stays changed for the rounded polygon.
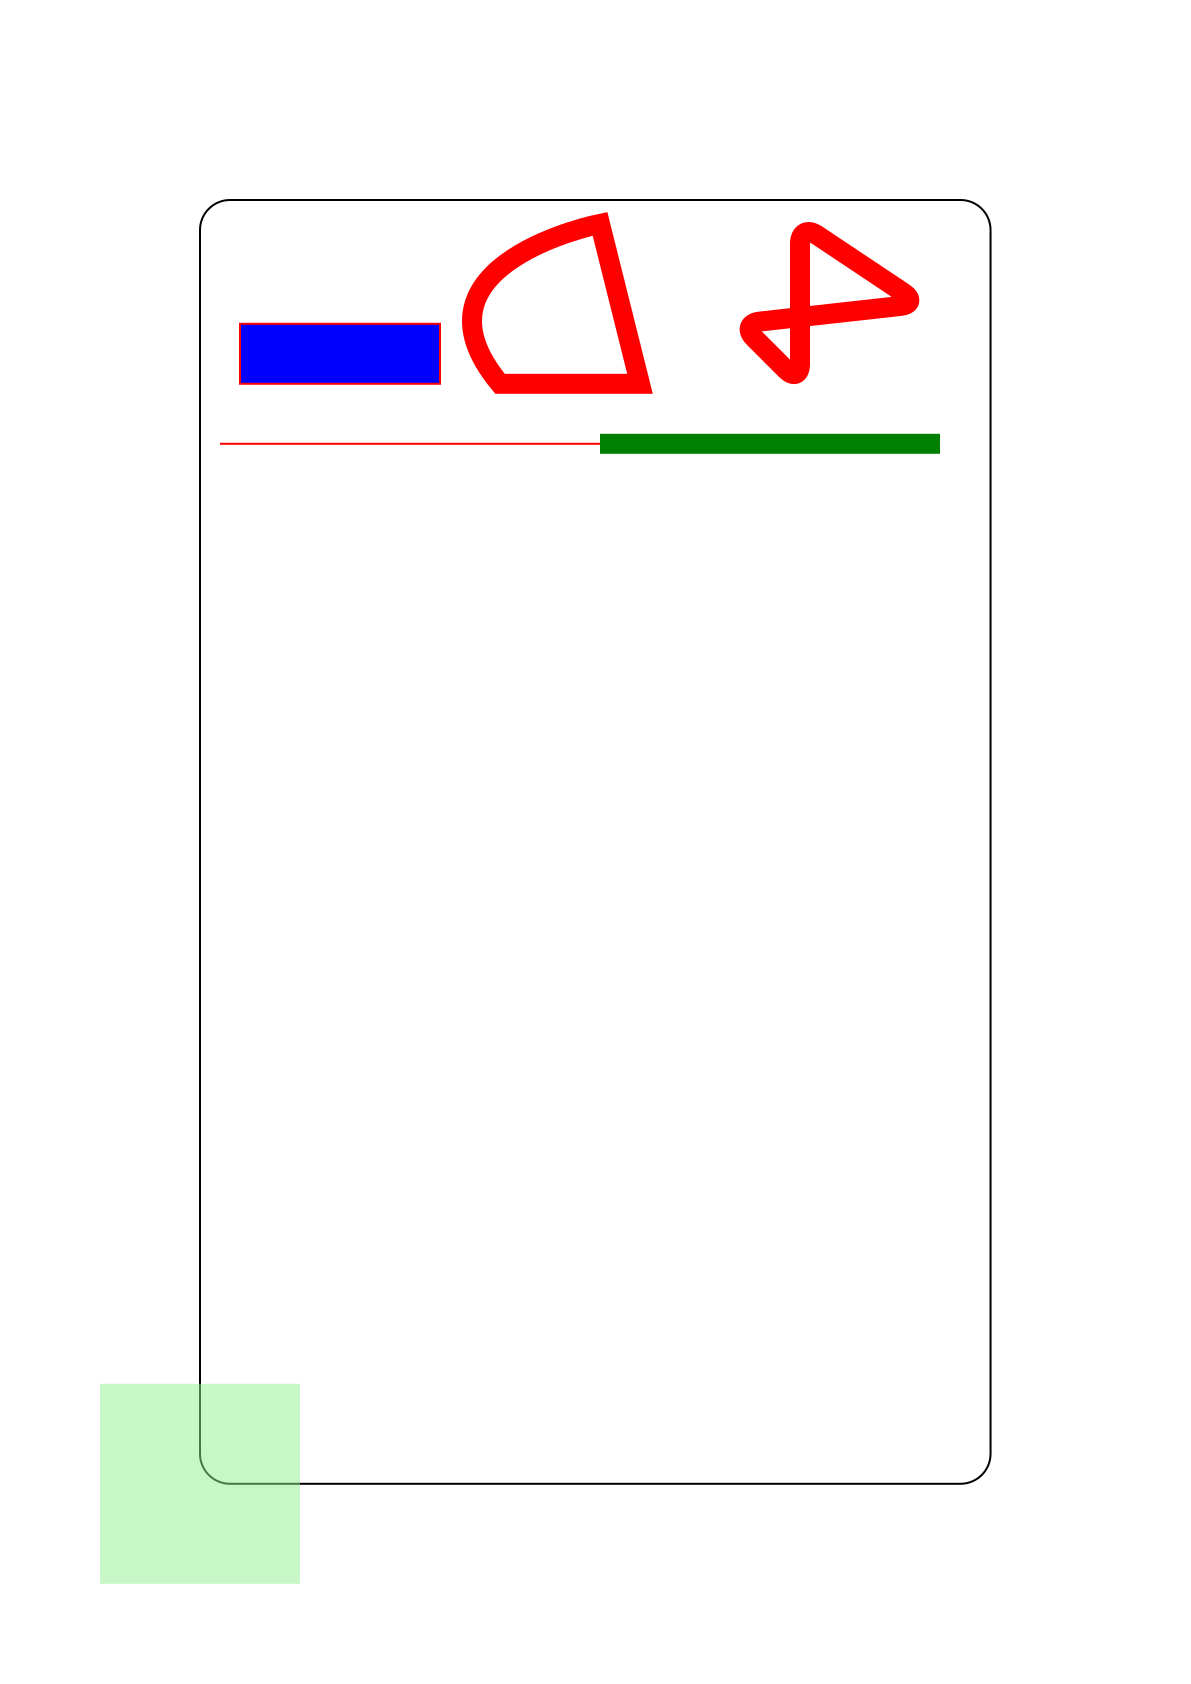
To restrict graphics state changes to only a part of the drawing operations, either use the block form of the methods or explicitly save and restore the graphics state:
canvas.line_width(1) do
  canvas.line(10, 520, 200, 520).stroke
end
canvas.save_graphics_state do
  canvas.stroke_color("green").line(200, 520, 370, 520).stroke
end
The canvas also features an extension system which allows one to easily draw more complex things, like a pie chart:
pie = canvas.graphic_object(:solid_arc, cx: 100, cy: 450,
                            outer_a: 50, outer_b: 50)
canvas.fill_color('aaaaff')
canvas.draw(pie, start_angle: 30, end_angle: 110).fill
canvas.fill_color('ffaaaa')
canvas.draw(pie, start_angle: 110, end_angle: 130).fill
canvas.fill_color('aaffaa')
canvas.draw(pie, start_angle: 130, end_angle: 30).fill
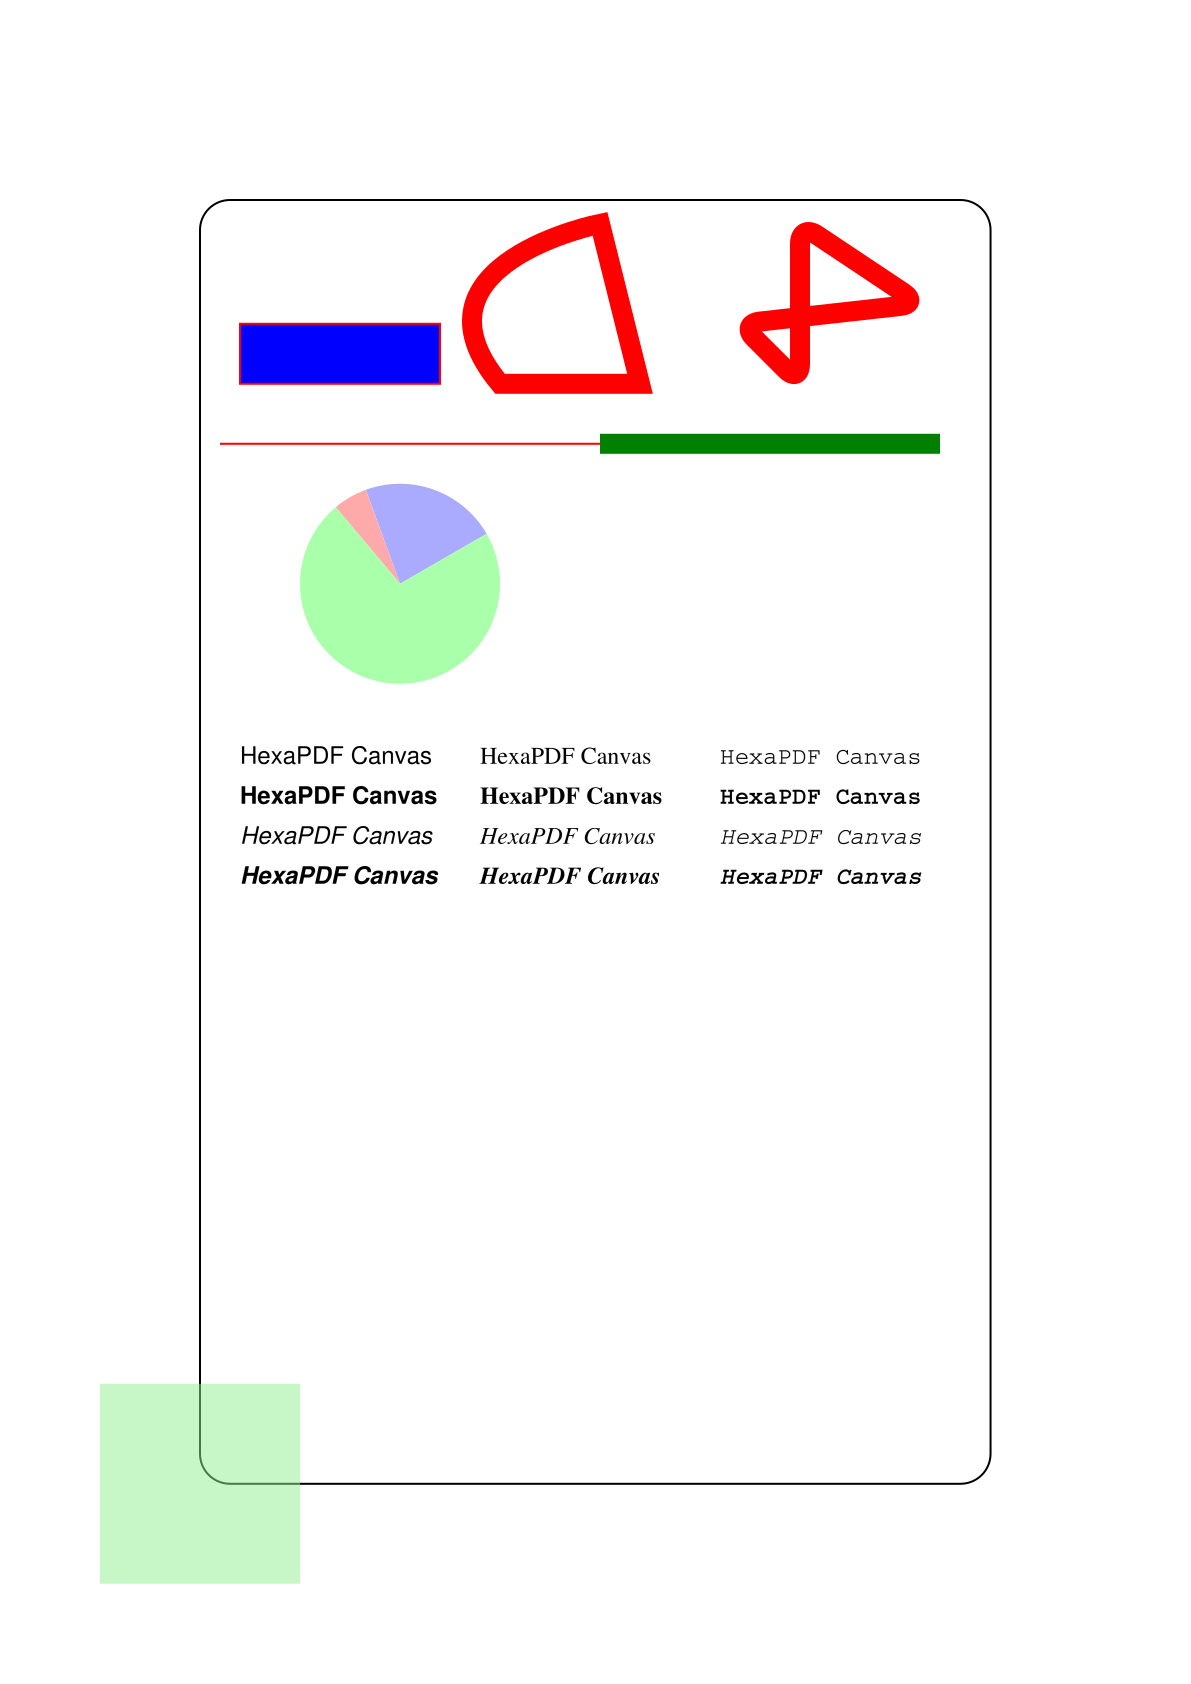
Drawing Text
Before any text can be drawn, one has to define at least the font and font size since there is no default value for both values.
PDF has built-in support for the fonts Helvetica, Times and Courier (all tree in normal, bold, italic and bold-italic variants) as well as Symbol and Zapf Dingbats (which are symbolic fonts). Those are called the 14 standard PDF fonts. Note that those fonts only contain a limited set of glyphs, see the standard PDF fonts example for a full list.
Let’s write some text in all standard non-symbolic PDF fonts:
canvas.fill_color("black")
['Helvetica', 'Times', 'Courier'].each_with_index do |font, x|
  [:none, :bold, :italic, :bold_italic].each_with_index do |variant, y|
    canvas.font(font, variant: variant, size: 12)
    canvas.text('HexaPDF Canvas', at: [20 + 120 * x, 360 - 20 * y])
  end
end
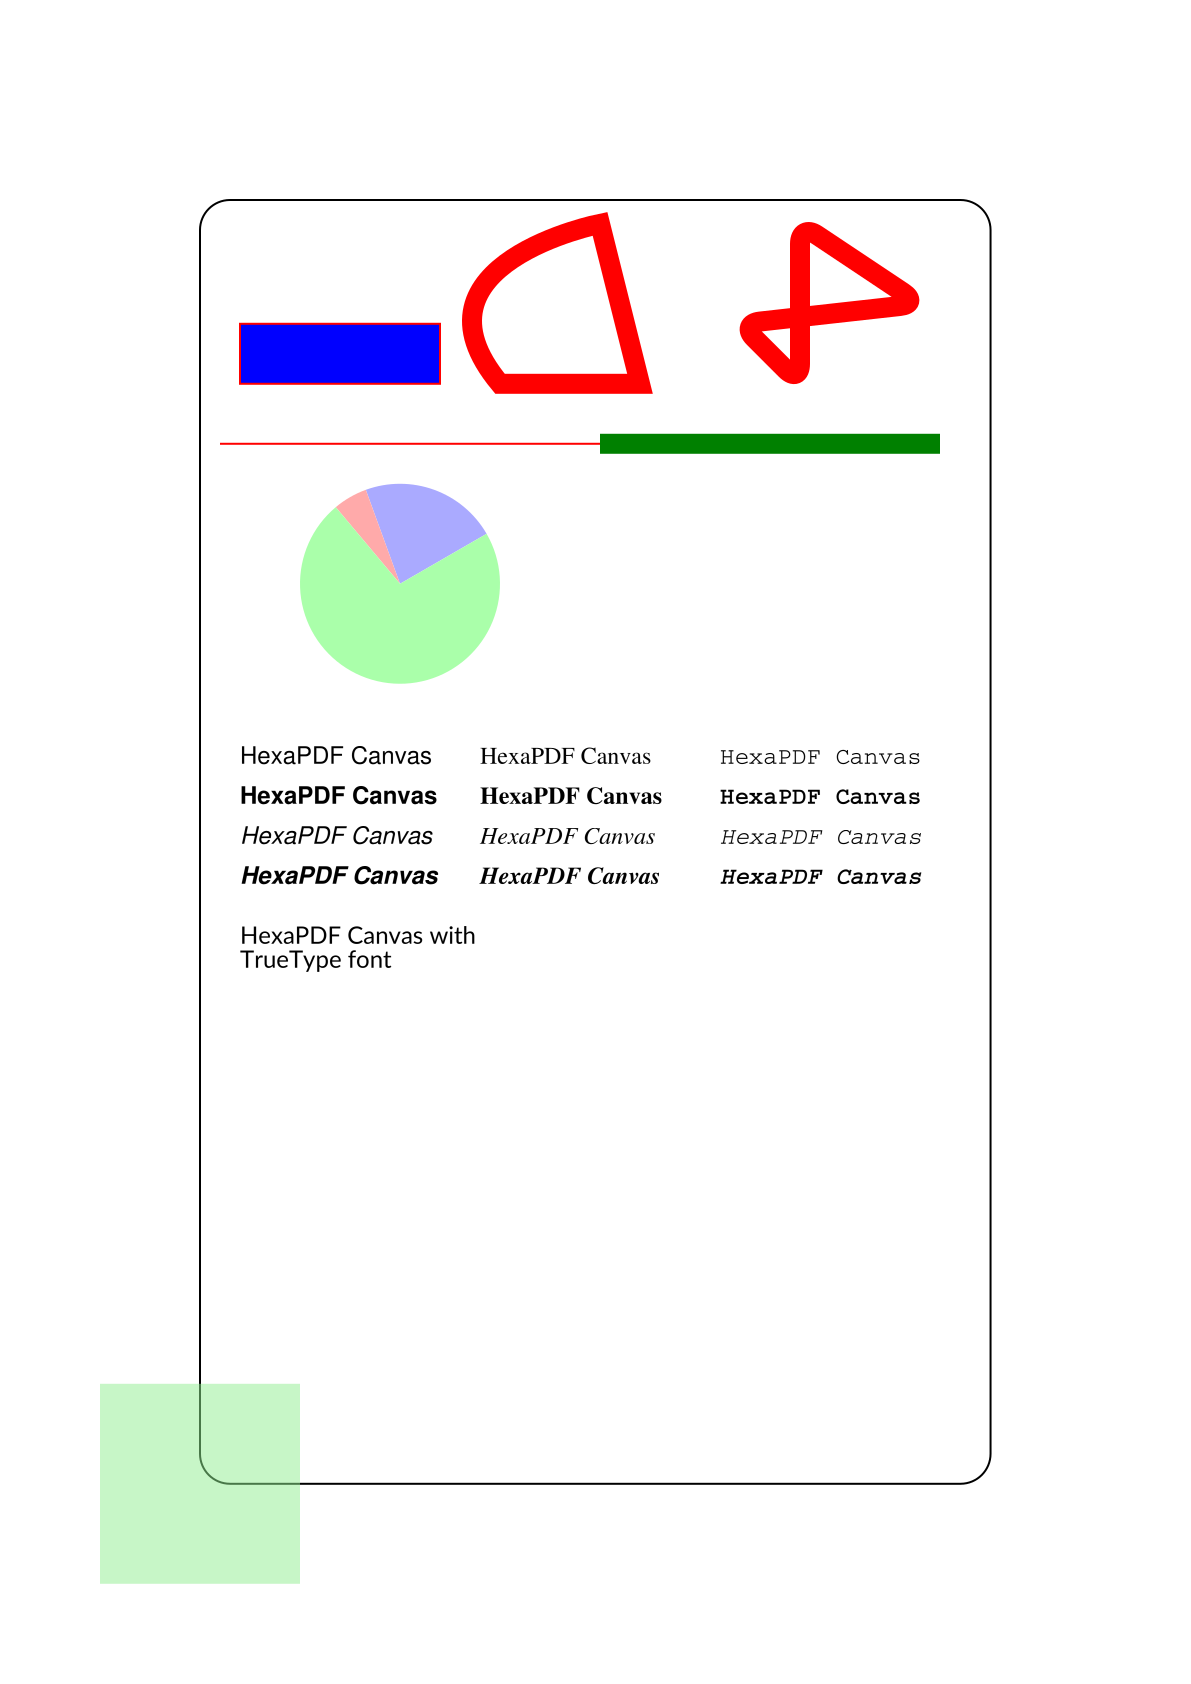
Besides the standard PDF fonts it is also possible to use any TrueType font with HexaPDF:
canvas.font('/usr/share/fonts/truetype/lato/Lato-Regular.ttf', size: 12)
canvas.text("HexaPDF Canvas with\nTrueType font", at: [20, 270])
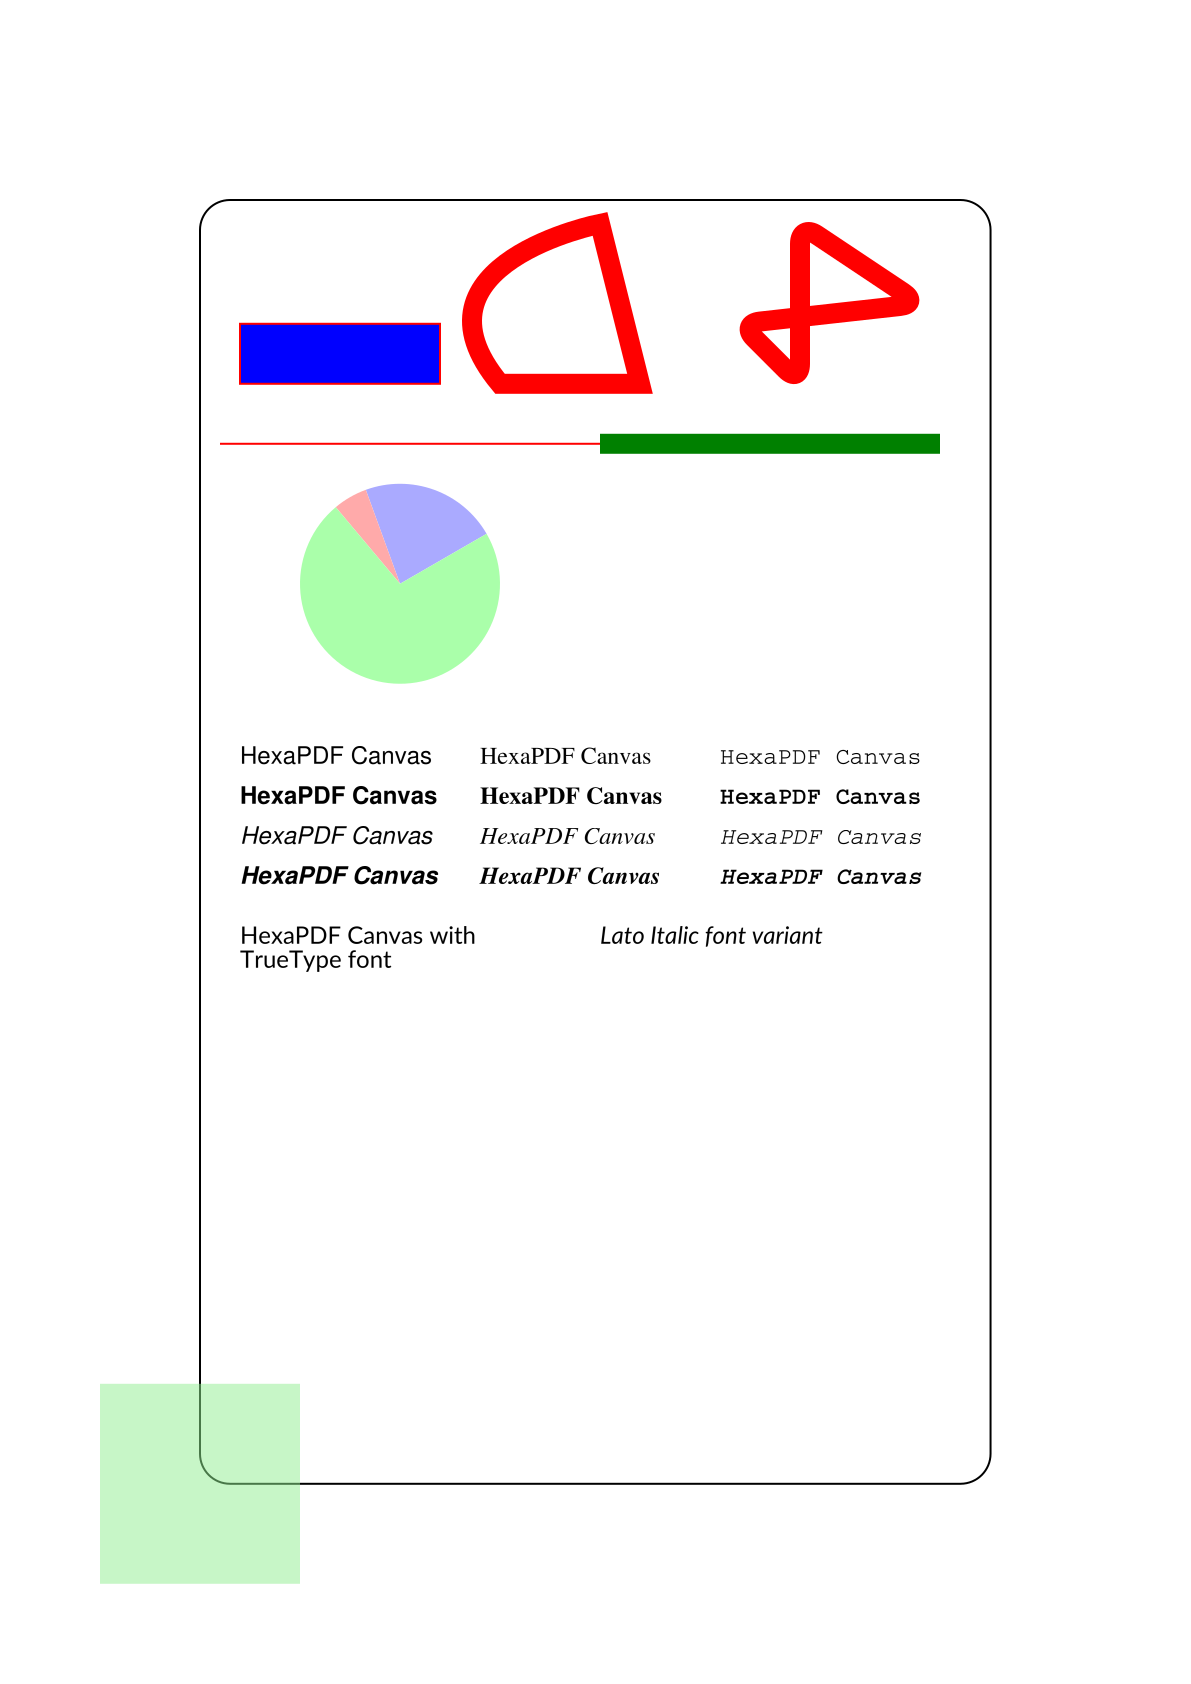
Either specify the font file directly, as above, or configure and reference it by name later:
doc.config['font.map'] = {
  'Lato' => {
    none: '/usr/share/fonts/truetype/lato/Lato-Regular.ttf',
    italic: '/usr/share/fonts/truetype/lato/Lato-Italic.ttf',
  }
}
canvas.font('Lato', variant: :italic)
canvas.text("Lato Italic font variant", at: [200, 270])
The #text method used here for drawing recognizes line breaks but nothing more. For more complex text output one would need to use HexaPDF::Layout::TextLayouter (low-level) or HexaPDF::Composer (high-level)a.
Reusing Graphics
At the beginning we introduced Form XObjects as the other PDF object type supporting a canvas. Form XObjects are used to define graphics once and use them multiple times.
One thing to remember is that Form XObjects do not reset the graphics state. So all the graphics state set when drawing a Form XObject will be used for the drawing operations of the Form XObject.
Let’s draw something on our Form XObject and then draw it twice:
form_canvas.rectangle(10, 10, 80, 80, radius: 10).stroke
form_canvas.ellipse(0, 0, a: 40, b: 25, inclination: 30).fill_stroke

canvas.xobject(form, at: [20, 120])
canvas.line_width(5).stroke_color("black").opacity(stroke_alpha: 0.5).
  fill_color("blue")
canvas.xobject(form, at: [220, 120])
As expected anything outside of the form’s bounding box is clipped and not visible when drawing the form. And it can clearly be seen that the change in the graphics state between the invocations influences the form’s drawing operations.
Now we just need to write the document
doc.write("canvas-tutorial.pdf")
which will conclude this tutorial!
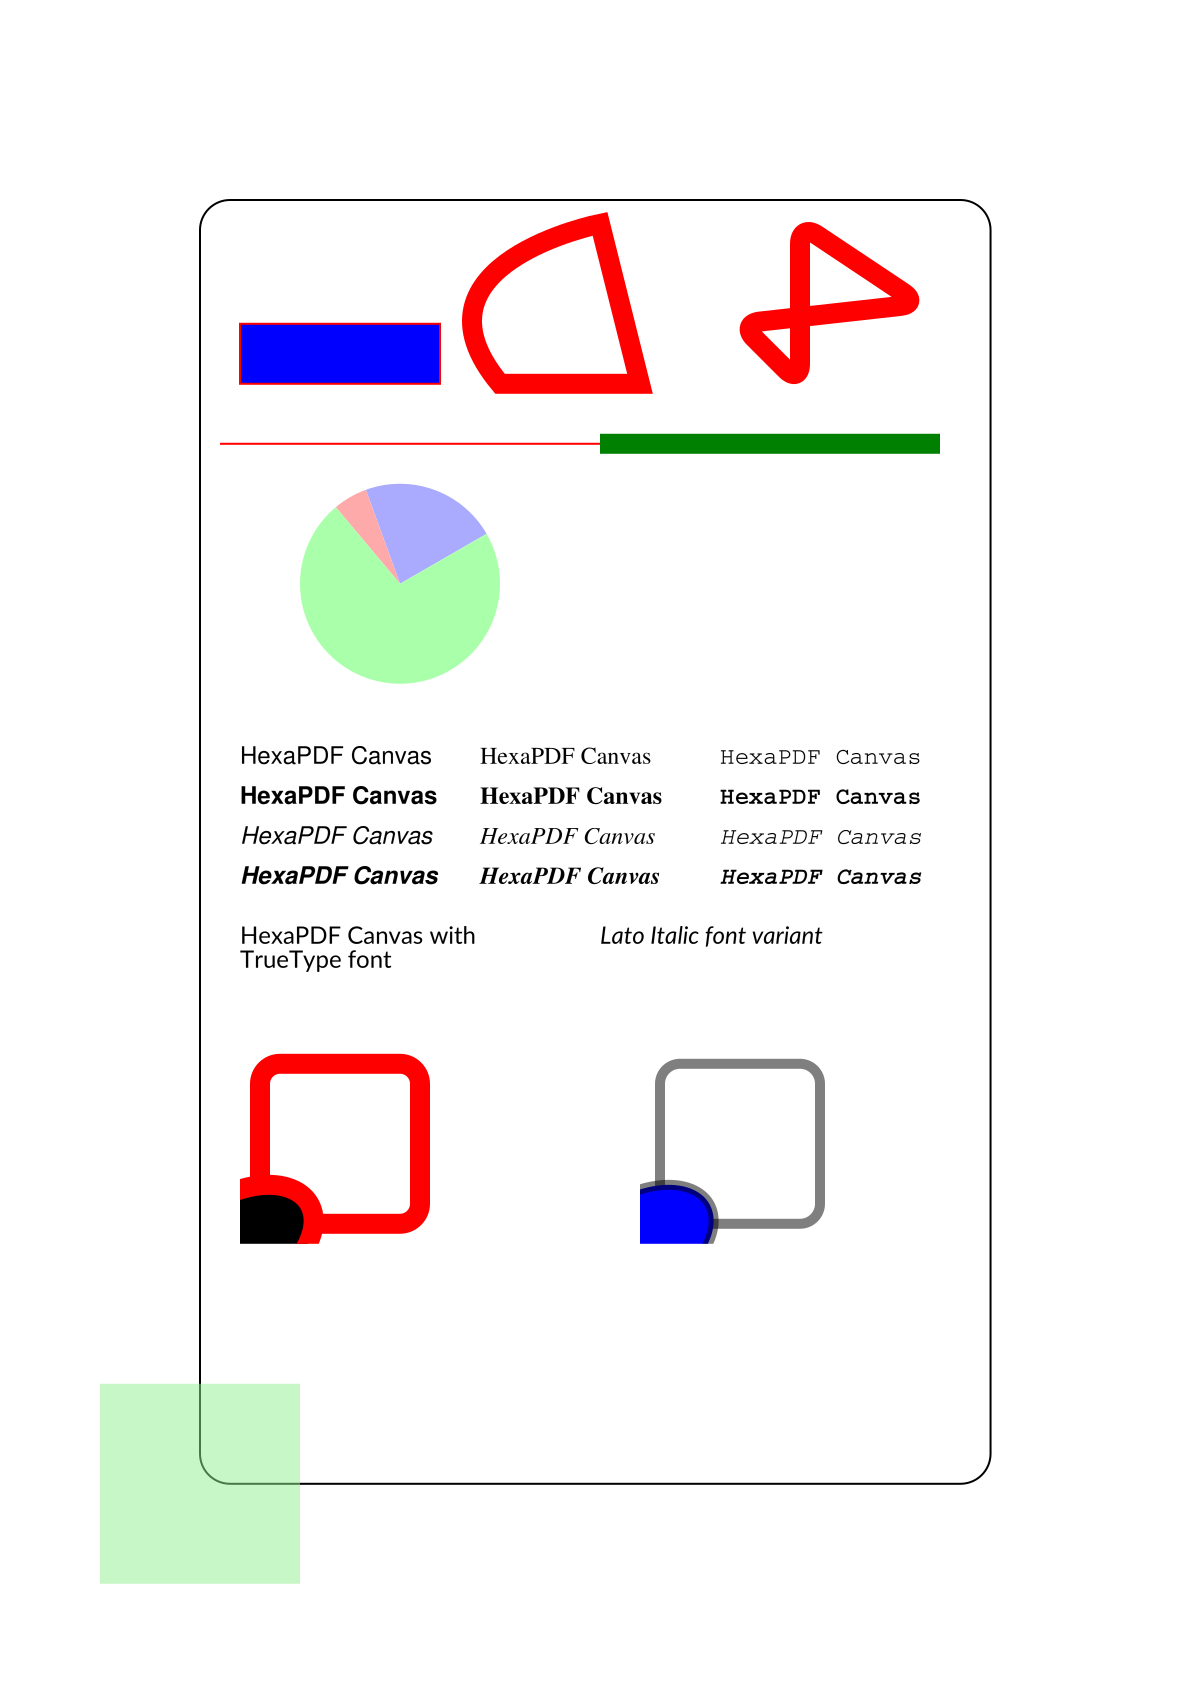
The Complete Code and Result PDF
Here is the complete code generating this result PDF:
require 'hexapdf'

doc = HexaPDF::Document.new

page = doc.pages.add
canvas = page.canvas

form = doc.add({ Type: :XObject, Subtype: :Form, BBox: [0, 0, 100, 100]})
form_canvas = form.canvas

page_box = canvas.context.box

canvas.translate(100, 100)
canvas.rectangle(0, 0, page_box.width - 200, page_box.height - 200, radius: 15).stroke

# Note that one would normally use canvas.pos(0, 0) for this
p canvas.graphics_state.ctm.evaluate(0, 0)  # prints [100, 100]

canvas.save_graphics_state do
  canvas.rectangle(-50, -50, 100, 100).clip_path.end_path  # restricts drawing operations
  canvas.fill_color("lightgreen").opacity(fill_alpha: 0.5).
    rectangle(-100, -100, 1000, 1000).fill
end

canvas.fill_color("blue").stroke_color("red").
  rectangle(20, 550, 100, 30).fill_stroke
canvas.line_width(10).
  move_to(150, 550).curve_to(200, 630, p1: [100, 610]).
  line_to(220, 550).close_subpath.stroke
canvas.polygon(300, 550, 300, 630, 360, 590, 270, 580, radius: 10).stroke

canvas.line_width(1) do
  canvas.line(10, 520, 200, 520).stroke
end
canvas.save_graphics_state do
  canvas.stroke_color("green").line(200, 520, 370, 520).stroke
end

pie = canvas.graphic_object(:solid_arc, cx: 100, cy: 450,
                            outer_a: 50, outer_b: 50)
canvas.fill_color('aaaaff')
canvas.draw(pie, start_angle: 30, end_angle: 110).fill
canvas.fill_color('ffaaaa')
canvas.draw(pie, start_angle: 110, end_angle: 130).fill
canvas.fill_color('aaffaa')
canvas.draw(pie, start_angle: 130, end_angle: 30).fill

canvas.fill_color("black")
['Helvetica', 'Times', 'Courier'].each_with_index do |font, x|
  [:none, :bold, :italic, :bold_italic].each_with_index do |variant, y|
    canvas.font(font, variant: variant, size: 12)
    canvas.text('HexaPDF Canvas', at: [20 + 120 * x, 360 - 20 * y])
  end
end

canvas.font('/usr/share/fonts/truetype/lato/Lato-Regular.ttf', size: 12)
canvas.text("HexaPDF Canvas with\nTrueType font", at: [20, 270])

doc.config['font.map'] = {
  'Lato' => {
    none: '/usr/share/fonts/truetype/lato/Lato-Regular.ttf',
    italic: '/usr/share/fonts/truetype/lato/Lato-Italic.ttf',
  }
}
canvas.font('Lato', variant: :italic)
canvas.text("Lato Italic font variant", at: [200, 270])

form_canvas.rectangle(10, 10, 80, 80, radius: 10).stroke
form_canvas.ellipse(0, 0, a: 40, b: 25, inclination: 30).fill_stroke

canvas.xobject(form, at: [20, 120])
canvas.line_width(5).stroke_color("black").opacity(stroke_alpha: 0.5).
  fill_color("blue")
canvas.xobject(form, at: [220, 120])

doc.write("canvas-tutorial.pdf")